Collapse all
Expand all
 

Graph view

The Graph view is an advanced toolbox that can be used to locate and identify faults in a reliable and quick way.

 
Fig. 158: The Graph view

To start monitoring the values in real time, click the Start button in the lower left part of the window. This starts a continuous readout of the DTC details from the vehicle and updates the Test Run indicator, Test Result indicator and Fault Counter. Click the button again to stop the monitoring.

1. Timeline

Note

Note

The following parts of the Timeline are clickable.

  • The gray or yellow line between First and Last. Clicking this line opens the First to Last test result pop-up.

  • The frozen values icon (). Clicking this icon opens the Frozen values pop-up.

  • The green line between Last and Now. Clicking this line opens the Last to Now test result pop-up.

See descriptions below for further information about the pop-ups.

By using the Timeline you can obtain the following information:

  • The level of fault intensity.

  • The number of control module operation cycles since the fault was last detected by the DTC test.

  • Values that were frozen when the fault was last detected as “worst” by the DTC test.

 
Fig. 159: The Timeline
 

Timestamps

The timestamps in the Timeline indicate when a fault has been detected and values have been frozen.

Timestamp

Description

First

Indicates the first occurrence the fault was detected by the DTC test.

Last

Indicates the last occurrence the fault was detected by the DTC test.

Frozen values

Indicates the time when the values were frozen.

Now

Indicates the latest time the DTC details were read out from the vehicle.

Note

Note

See Interpreting the Timeline for further instructions on how to interpret the data.

2. Frozen values

By clicking the frozen values icon () in the timeline, a pop-up containing a list of frozen values is displayed. To see the details about the frozen values, expand the parameter descriptions by clicking the buttons. The frozen values can be used to identify the vehicle's operation condition and environment condition the last time the fault was detected by the DTC test as "worst" (i.e. was detected as unconfirmed, failed or confirmed). If the fault is not present and detected by the DTC test, it should appear again when the vehicle's operation condition and environment is repeated. If the fault appears again, the fault tracing will be much easier.

 
Fig. 160: The Frozen values pop-up
 

The frozen values icon () in the timeline can have one of the following three colors that indicate the status of the DTC when the values were frozen:

Color indication

Status

Description

Confirmed

Long duration fault detected many times by the in-vehicle DTC test.

Failed

Long duration fault detected one time by the in-vehicle DTC test.

Unconfirmed

Short duration fault detected by the in-vehicle DTC test.

Note

Note

See Interpreting the Frozen values for further instructions on how to interpret the data.

Only the latest frozen values are stored. Values of data parameters are sampled and stored each time the DTC is unconfirmed until test has been failed and then each time the test is failed until the DTC has been confirmed. No more values of data parameters are sampled and stored after the DTC has been confirmed and prior erase of DTCs.

3. First to Last test result


The left part of the timeline, between the timestamps First and Last can have one of the following two colors. The colors indicate the status of the DTC when the timestamps were taken and when the number of the control module operation cycles that is displayed in the Test result indicator, was calculated:

Color indication

Status

Description

Failed

Long duration fault detected one time by the in-vehicle DTC test.

Unconfirmed

Short duration fault detected by the in-vehicle DTC test.

By clicking this part of the timeline, a pop-up containing a diagram of the test result is displayed. In this pop-up you can see the number of operation cycles of the control module that have been performed between the timestamps First and Last and how the result has been distributed between these timestamps.

 
Fig. 161: The First to Last Test result pop-up

Note

Note

See Interpreting the First to Last test result for further instructions on how to interpret the data.

4. Last to Now test result

The right part of the timeline, between the timestamps Last and Now is always green. By clicking this part of the timeline, a pop-up containing a diagram of the test result is displayed.

In this pop-up you can see the number of operation cycles of the control module that have been performed between the timestamps Last and Now and how the result has been distributed between these timestamps.

 
Fig. 162: The Last to Now Test result pop-up

Note

Note

See Interpreting the Last to Now test result for further instructions on how to interpret the data.

5. Test Run indicator

In the Test Run indicator you can check if the test has started and been completed. The values are presented for the current control module operation cycle and for all control module operation cycles since last erase of DTCs. In the Test Run indicator you can also see the maximum value that the fault counter has reached since start of continuous readout of DTC details from the vehicle and since erase of DTCs.

 
Fig. 163: The Test Run indicator

Note

Note

If the test is not started, make sure that the test run criteria are fulfilled.


The following information can be obtained by checking the Test Run indicator:

Name

Status/Value

Description

Completed

Yes

Test completed.

No

Test not completed.

Started

Yes

Test run criteria fulfilled

No

Test run criteria not fulfilled

Maximum since erase

1-127

Maximum value of the fault counter since erase of DTCs.

Maximum since start

1-127

Maximum value of the fault counter since start of continuous readout and updates of the values of the fault counter, etc.

Note

Note

See Interpreting the Test Run indicator for further instructions on how to interpret the data.

6. Test Result indicator

In the Test Result indicator you can see test results for different statuses in three different time periods.

 
Fig. 164: The Test Result indicator
 

The columns are reflecting test results for the following three time periods:

Time period

Description

Now

This column reflects real time values from the continuous readout that starts running once the Start button below the Fault counter has been clicked.

This Cycle

This column reflects values from the current control module operation cycle. An operation cycle is started when the control module powers up and starts its operation and is stopped when the control module stops its operation and powers down.

Since Erase

This column reflects values since last erase of DTCs.


Test results for the following statuses are shown.

Status

Color indication

Description

Warning indicator

Detected fault causes customer message e.g. 'Warning' or 'Service required'.

Symptom

Detected fault has caused customer symptom.

Confirmed

Long duration fault detected many times by the in-vehicle DTC test.

Pending

Long duration fault detected one or more times by the in-vehicle DTC test.

Failed

Long duration fault detected one time by the in-vehicle DTC test.

Unconfirmed

Short duration fault detected by the in-vehicle DTC test.

Test results marked in green indicates that the test passed without detecting any faults.

The more test results that is marked with Yes, the higher probability that the fault (pointed out by the DTC) exists and is present. In such case the fault is most likely causing a lasting symptom that is so serious that the customer visits a workshop to get the fault fixed. The probability that a fault tracing would be successful (i.e. the fault will be found) is in these cases high.

Note

Note

See Interpreting the Test Result indicator for further instructions on how to interpret the data.

7. Calibration parameters panel

The Calibration parameters panel views set parameters for the DTC. This data is fetched from a central Volvo system.

 
Fig. 165: The Calibration panel

Note

Note

See Interpreting the Calibration parameters for further instructions on how to interpret the data.

8. Fault counter

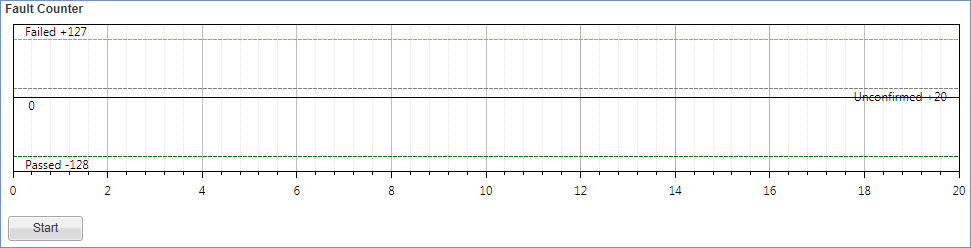
The Fault counter is the most central part of the Graph view and plots the value of the current DTC (captured by the in-vehicle DTC test) in a graph. You can follow the graph to see if it currently reached maximum values and other limits in order to draw conclusions on the fault's behaviors and degree of severity. The fault counter steps (or jumps) up each time the test detects a fault. The fault counter steps (or jumps) down each time the test tries to detect a fault but no fault is detected.

Note

Note

The fault counter behaves differently depending on what type of DTC is being monitored. See Interpreting information in the Graph view.

 
Fig. 166: The Fault counter

To start monitoring values in the fault counter, click the Start button. This starts a continuous readout and DTC details are displayed in real time. Click the button again to stop the monitoring.

Note

Note

If the test is not started, make sure that the test run criteria are fulfilled.

When the test has started and is running, try to recreate the environmental and operational conditions that were present when the fault occurred in the vehicle. Also try to reproduce the fault by e.g. jiggling wires to component or by jiggling the component itself. If you manage to reproduce the fault, the fault counter as mentioned above step (or jump) up to indicate 
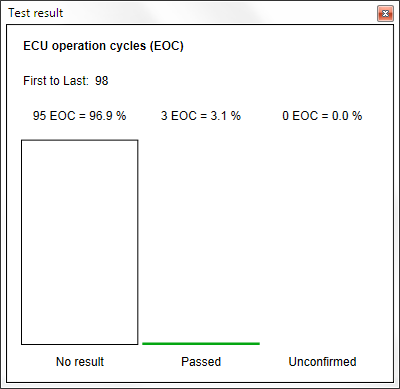
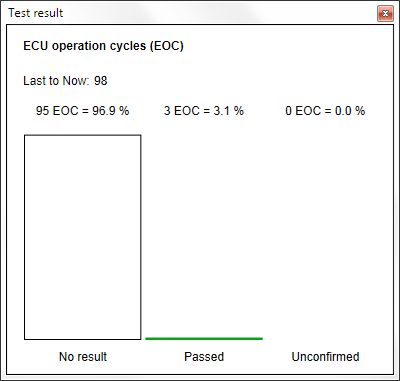
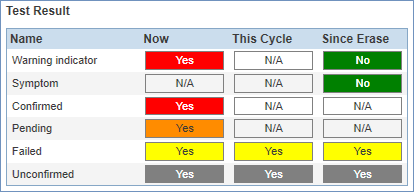
that the fault is active. The test result also shows when a fault limit (Failed and Unconfirmed) is reached.
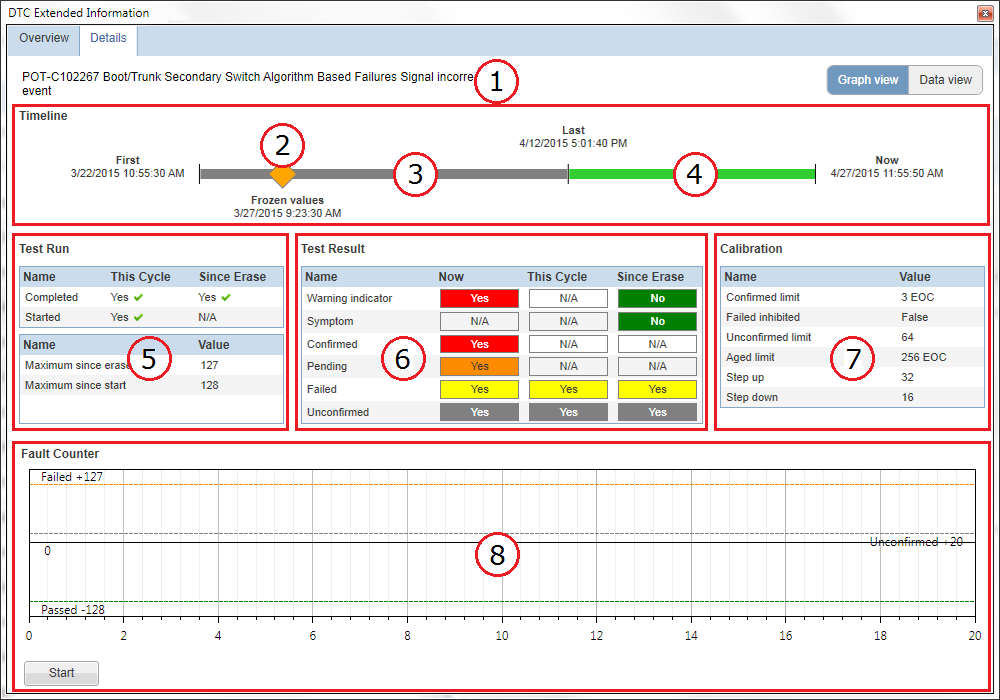
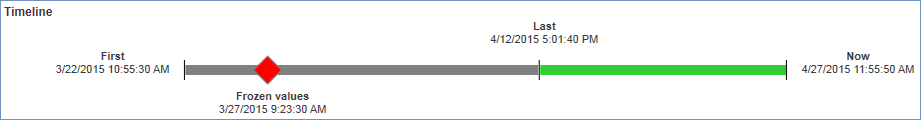
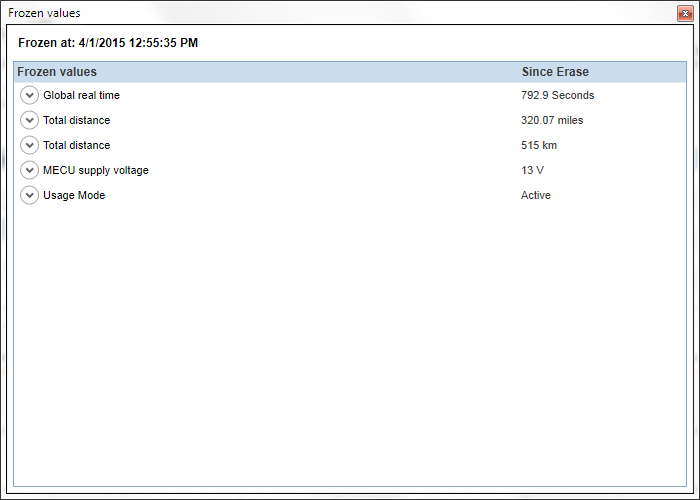
Note

Note

See Interpreting the Fault counter for further instructions on how to interpret the data.

You may also be interested in:

Interpreting information in the Graph view