The description below is presented twice since the fault counter behaves differently depending on what type of DTC that is being monitored. See the article Interpreting information in the Graph view for further information.
Unconfirmed DTC limit is +127
This data is accessed by clicking the left part of the timeline. The description below is applicable when the Unconfirmed limit and the Failed limit are the same i.e. +127. Please refer to the article Interpreting the Fault counter for further details about the Fault counter.
Figure description (number 1-3)
|
Fig. No. |
Description |
|---|---|
|
1 |
Failed limit |
|
2 |
Unconfirmed limit |
|
3 |
Passed limit |
Figure description (number 4-6)
|
Test result in % of all control module operation cycles between First and Last |
Fault |
Symptom |
Fault tracing |
|||||
|---|---|---|---|---|---|---|---|---|
|
Failed |
Passed |
No result |
||||||
|
Test reached the Failed limit at least once. See fig. no. 4. |
Test reached the Passed limit at least once but never the Failed limit. See fig. no. 5. |
Test did not reach the Failed limit or the Passed limit. See fig. no. 6. |
||||||
|
High value  Low value |
Low value High value |
Low value |
High frequent Low frequent |
Most likely Least likely |
Probably most easy Probably most difficult |
|||
|
Low value |
Low value |
High value |
Unknown frequency |
Unknown probability |
Unknown probability |
|||
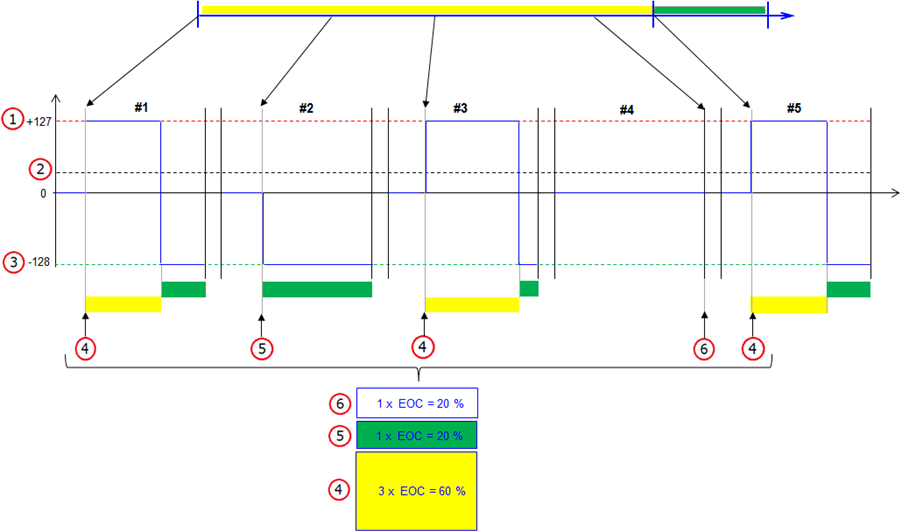


#1 - #5 in the figure represent control module operation cycles.
EOC in the figure is the abbreviation of control module operation cycle.
Unconfirmed DTC limit is less than +127
This data is accessed by clicking the left part of the timeline. The description below is applicable when the Unconfirmed limit is less than the Failed limit i.e. less than +127. Please refer to the article Interpreting the Fault counter for further details about the Fault counter.
Figure description (number 1-3)
|
Fig. No. |
Description |
|---|---|
|
1 |
Failed limit |
|
2 |
Unconfirmed limit |
|
3 |
Passed limit |
Figure description (number 4-6)
|
Test result in % of all control module operation cycles between First and Last |
Fault |
Symptom |
Fault tracing |
|||||
|---|---|---|---|---|---|---|---|---|
|
Unconfirmed |
Passed |
No result |
||||||
|
Test reached the Unconfirmed limit (or above) at least once. See fig. no. 4. |
Test reached the Passed limit at least once but never the Unconfirmed limit. See fig. no. 5. |
Test did not reach the Unconfirmed limit or the Passed limit. See fig. no. 6. |
||||||
|
High value Low value |
Low value High value |
Low value |
High frequent Low frequent |
Most likely Least likely |
Probably most easy Probably most difficult |
|||
|
Low value |
Low value |
High value |
Unknown frequency |
Unknown probability |
Unknown probability |
|||
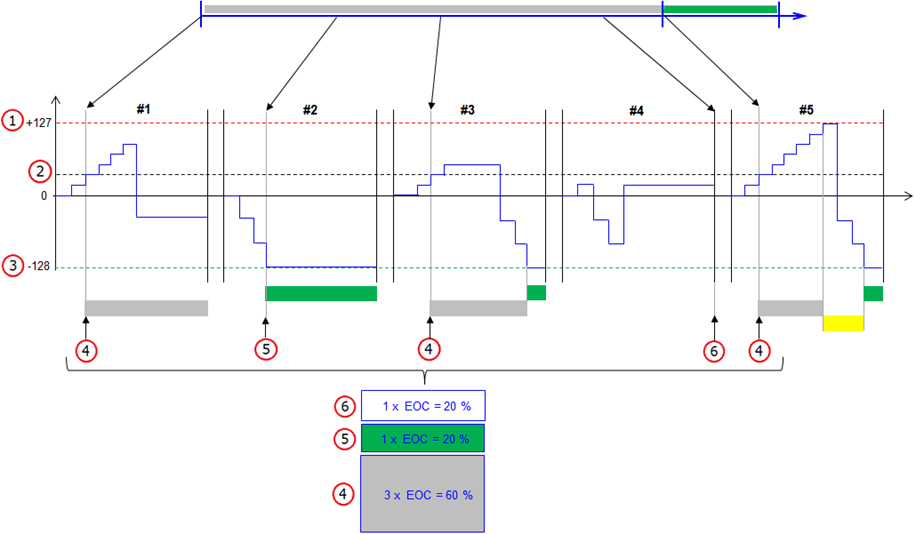

#1 - #5 in the figure represent control module operation cycles.
EOC in the figure is the abbreviation of control module operation cycle.