The description below is presented twice since the fault counter behaves differently depending on what type of DTC that is being monitored. See the article Interpreting information in the Graph view for further information.
Unconfirmed DTC limit is +127
The description below is applicable when the Unconfirmed limit and the Failed limit are the same i.e. +127. Please refer to the article Interpreting the Fault counter for further details about the Fault counter.
Figure description (number 1-3)
|
Fig. No. |
Description |
|---|---|
|
1 |
Failed limit |
|
2 |
Unconfirmed limit |
|
3 |
Passed limit |
Figure description (number 4-6)
|
Time stamp |
Description |
Symptom |
Fault tracing |
|---|---|---|---|
|
Real time first and last. |
First and last real time (since erase of DTCs) the fault counter reaches the test limit. See the figure below for details and illustrative support. See the figure below for details where fig. no. 4 represents first real time, 5 last real time and 6 now. |
Customer has noticed symptom between first and last. |
Probably most easy. |
|
Customer has not noticed symptom between first and last. |
Probably most difficult. |
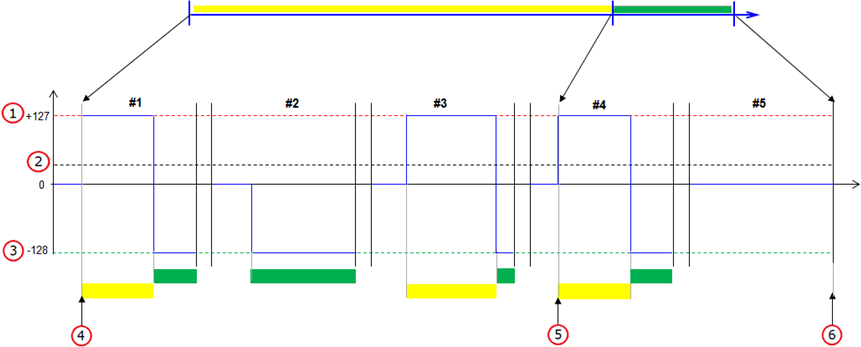


#1 - #5 in the figure represent control module operation cycles.
Unconfirmed DTC limit is less than +127
The description below is applicable when the Unconfirmed limit is less than the Failed limit i.e. less than +127. Please refer to the article Interpreting the Fault counter for further details about the Fault counter.
Figure description (number 1-3)
|
Fig. No. |
Description |
|---|---|
|
1 |
Failed limit |
|
2 |
Unconfirmed limit |
|
3 |
Passed limit |
Figure description (number 4-6)
|
Time stamp |
Description |
Symptom |
Fault tracing |
|---|---|---|---|
|
Real time first and last. |
First and last real time (since erase of DTCs) the fault counter reaches the test limit. See the figure below for details and illustrative support. See the figure below for details where fig. no. 4 represents first real time, 5 last real time and 6 now. |
Customer has noticed symptom between first and last. |
Probably most easy. |
|
Customer has not noticed symptom between first and last. |
Probably most difficult. |
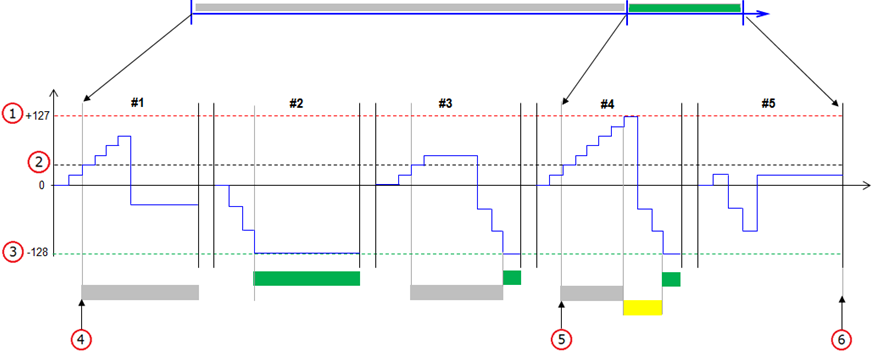

#1 - #5 in the figure represent control module operation cycles.