

 icon is shown next to the action to indicate that it has been performed and that the fault was found.
 icon is shown next to the action to indicate that it has been performed and that the fault was not found.
 icon is shown next to the action to indicate that it has been viewed.
Note
Please use the buttons described above to indicate when actions are successful or unsuccessful. Your feedback is valuable to evaluate and improve the priority values in the ranked list.
To successfully perform a fault tracing, it is essential that all the control modules in the vehicle are connected and respond to the VIDA connection. When a vehicle is read out, some of the control modules may indicate that faults have been recorded or that they are not responding to communication. In this case, you need to correct the issues with the control modules before proceeding with the actual fault tracing.
The Network page helps you identify issues on the network in the vehicle. Such an issue could e.g. be a connection issue, or that the hardware itself is malfunctioning.
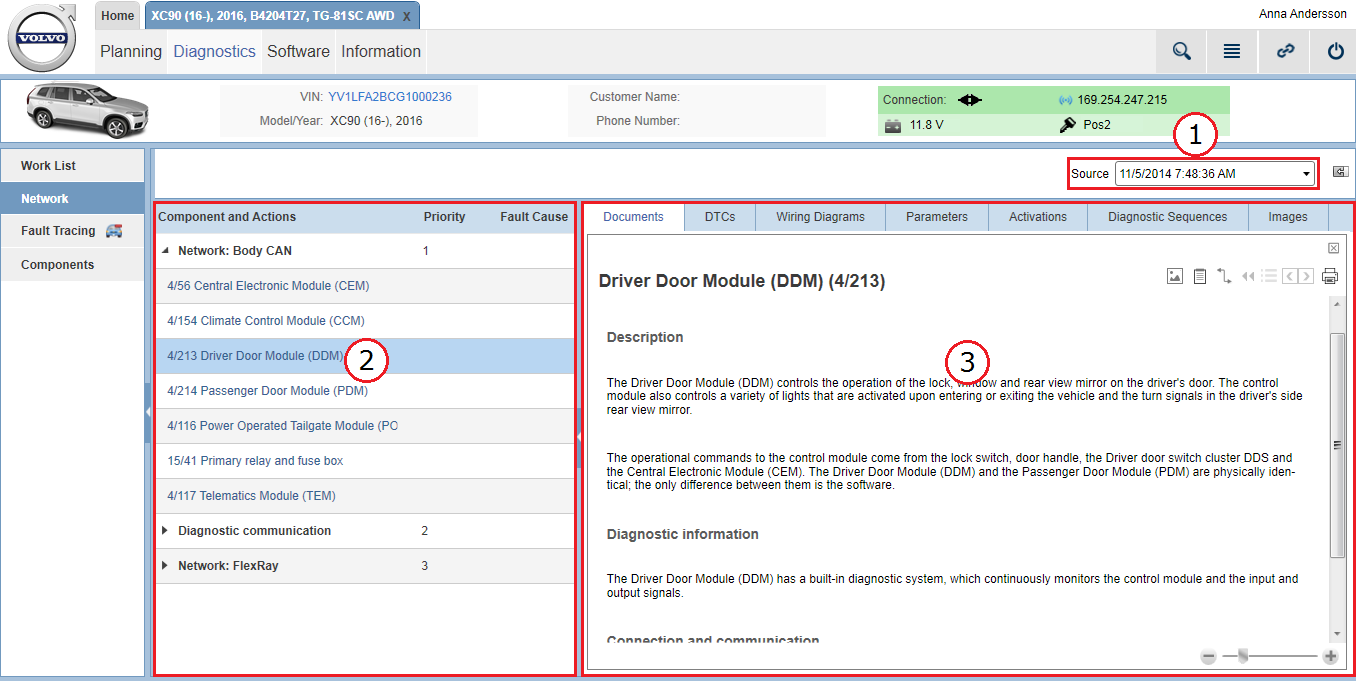
This page is divided into three main sections:
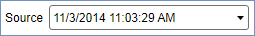
The information on the Network page reflects information from the latest vehicle readout by default. By using this drop-down menu you can select previously performed vehicle readouts in order to see the vehicle's status at specific times. All information on the Network page is related to the readout time selected in this drop-down menu. When another readout than the latest one is selected, the drop-down menu is marked in red.
Please note that previously performed vehicle readouts represent an old snapshot of the vehicle status. If you have selected to view information from a previously performed vehicle readout, remember to switch back to the latest readout in the drop-down menu in order to view the latest information again.
This list contains relevant components and actions for fault tracing the vehicle's network. The components presented in this list, e.g. control modules, wires, relays and fuse boxes, are the ones that are the most likely to cause the problem that VIDA has detected on the network. In the list you can see all networks in the vehicle. The list is ranked and grouped by networks in the vehicle. It is always the network group in the top of the list that is most likely faulty. You should always start fault tracing the first network in the list and work your way down. Each network group is ranked in the same way with the most likely faulty component on top.
Use the  icon to expand a network category in the ranked list in order to see the components and actions that are included in the
network. The components and actions in each network group are ranked in descending order as well.
icon to expand a network category in the ranked list in order to see the components and actions that are included in the
network. The components and actions in each network group are ranked in descending order as well.
The ranked list is structured in three columns:
|
Column |
Description |
|
|---|---|---|
|
Component and Actions |
This column displays the titles of the networks and their components and actions in the ranked list. Actions are shown under certain components if there is something you should perform or check to verify the component. All actions have an icon and blue font. See the subsection below for additional information. All electrical components are marked with the electrical designation in front of the name, e.g. ' |
|
|
Priority |
The ranked list is sorted on priority values. The lower the priority value of a network is, the more likely it is to cause problems. The networks and their components that are listed are sorted ascending according to these values with the most likely cause of the fault on top. The priority values are provided by experts at Volvo Cars and are based on collective knowledge within the company. You are always recommended to perform network fault tracing actions based on the ranked list. However, you are of course still free to select any action based on your preferences, experience and expertise. |
|
|
Fault cause |
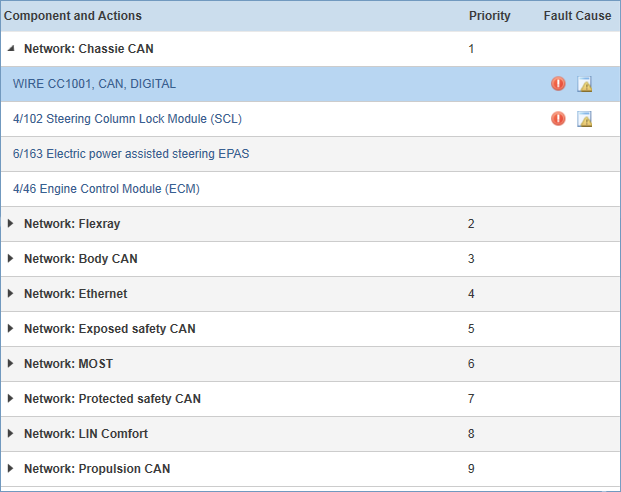
Two icons may appear for components and actions in this column: |
|
|
|
At least one set DTC is related to the component. Hoover the cursor over the icon to see additional DTC information. Please note that this icon is only triggered by confirmed DTCs. See the article DTCs for additional information. |
|
|
|
Cause of failure information is available for the component. Hoover the cursor over the icon to see additional information. Cause of failure information can e.g. be 'Circuit open' or 'Not responding'. |
|
Actions are shown below certain components if there is something you should perform or check in order to verify the component.
All actions have blue font and an icon (e.g.  or
or  ) to indicate type of action. By clicking an action, the ranked list is temporarily replaced by a document that describes
the selected action.
) to indicate type of action. By clicking an action, the ranked list is temporarily replaced by a document that describes
the selected action.
The following four buttons are always available below a selected action:
|
button |
Description |
|---|---|
|
|
Use this button if you did found the fault by using the action. This closes the action and the ranked list is shown again.
The |
|
|
Use this button if you did not find the fault by using the action. This closes the action and the ranked list is shown again.
The |
|
|
Use this button to mark the action as done. This is e.g. applicable if you do not know if the action helped you finding the
fault or not. This closes the action and the ranked list is shown again. The |
|
|
Use this button to cancel the action. When this button is used, no icon will be shown next to the action in the ranked list. |
You can change a previously set value in the ranked list anytime by clicking one of the three icons described in the table above. It is also possible to set a value without opening the action.
Note
Note
Please use the buttons described above to indicate when actions are successful or unsuccessful. Your feedback is valuable to evaluate and improve the priority values in the ranked list.
In this panel on the right-hand side of the screen, all fault tracing information and functions related to the selected component or action in the ranked list are available.
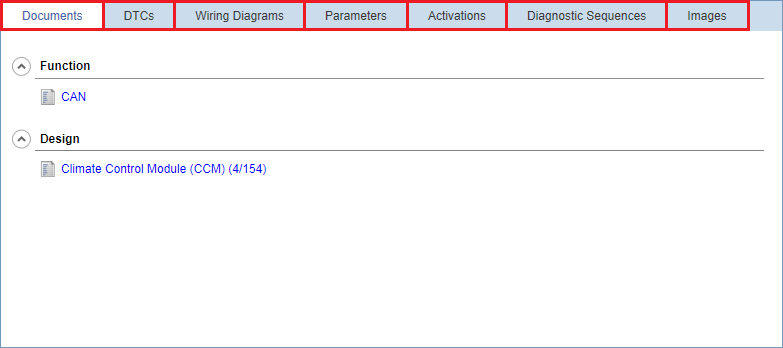
The network fault tracing information and functions are divided into the following tabs:
You may also be interested in: